
Amongst some of the most important aspects of production environments are monitoring and instrumentation. In this post I will look at how to combine Spring Actuator, Prometheus and Grafana to deliver production grade instrumentation on the Spring Boot RESTful Service created in part one.
“You can’t manage what you don’t measure”— W. Edwards Deming
Actuator
Spring Actuator does most of the heavy lifting when it comes to instrumentation by providing a number features to help manage applications in production. Actuator features are exposed as Endpoints and it ships with quite a few out of the box. Installing Actuator is as simple as adding the Actuator Spring Boot Starter to the build.gradle file:
dependencies {
    //...
    compile("org.springframework.boot:spring-boot-starter-actuator")
    //...
}
After installation the default Endpoints will be listed under http://localhost:8080/actuator
curl http://localhost:8080/actuator

{
  "_links" : {
    "self" : {
      "href" : "http://localhost:8080/actuator"
    },
    "mappings" : {
      "href" : "http://localhost:8080/mappings"
    },
    "beans" : {
      "href" : "http://localhost:8080/beans"
    },
    "dump" : {
      "href" : "http://localhost:8080/dump"
    },
    "trace" : {
      "href" : "http://localhost:8080/trace"
    },
    "info" : {
      "href" : "http://localhost:8080/info"
    },
    "autoconfig" : {
      "href" : "http://localhost:8080/autoconfig"
    },
    "env" : {
      "href" : "http://localhost:8080/env"
    },
    "configprops" : {
      "href" : "http://localhost:8080/configprops"
    },
    "health" : {
      "href" : "http://localhost:8080/health"
    },
    "metrics" : {
      "href" : "http://localhost:8080/metrics"
    }
  }
}
Prometheus
Prometheus is an open-source time series database that provides considerable capability in analyzing application metrics over time. Although prometheus provides many ways to integrate with it, the simplest way is configuring it to periodically poll the target application to gather metrics. Spring Actuator already provides a metrics endpoint at http://localhost:8080/metrics but it is not in a format that Prometheus can consume. Fortunately Spring makes it easy to add custom endpoints and this post will cover how to bridge the gap between Actuator and Prometheus.
Install the Prometheus client JAR by adding it to the build.gradle file:
dependencies {
//...
	compile('io.prometheus:simpleclient:0.0.13')
	compile('io.prometheus:simpleclient_common:0.0.13')
//...
}
Gauges & Counters
Metrics fall broadly into two main categories, counters and gauges. These metrics exist in both Actuator and Prometheus.
Counters are cumulative metrics that represent a single numerical value which only ever increases. For example, it can be utilized to count the number HTTP 500 responses generated by the application.
Gauges on the other hand are metrics that represent a single numerical value which can arbitrarily increase and decrease. They are typically used to measure things like average response time.
Parts of an Actuator Endpoint
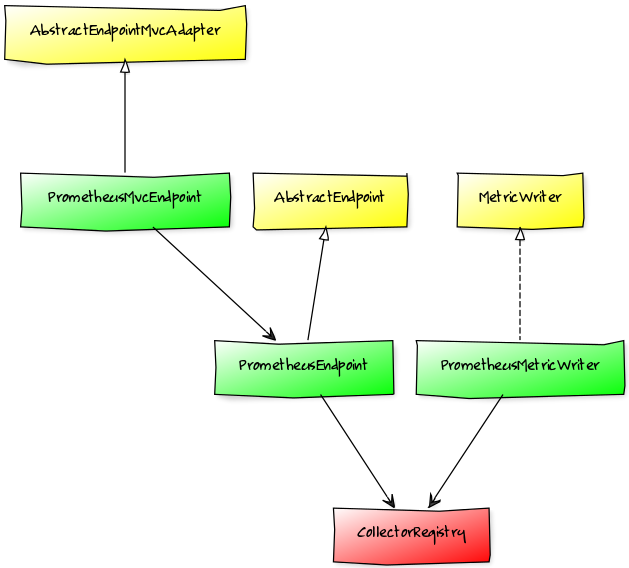
Basically Spring Actuator provides three extension points for custom Endpoints as illustrated by the yellow classes. The core of the extension is the AbstractEndpoint, which is used to expose useful information about the application. AbstractEndpointMvcAdapter adapts Endpoints to the MVC layer thereby allowing access to Endpoints over HTTP. The first two mentioned classes are concerned with exposing information, the MetricWriter is used to collect the information. MetricWriters are periodically notified of snapshot Metric values, which provide the ideal opportunity to export the metrics. The red CollectorRegistry is provided by Prometheus client API and is used to register and update gauges and counters for Prometheus. To allow Prometheus to understand Actuator Metrics we need to implement the green classes.
PrometheusMetricWriter
The PrometheusMetricWriter is periodically called with metric updates and it in turn simply updates the corresponding Counter or Gauge in the Prometheus CollectorRegistry. It also takes care of creating the Counter or Gauge if it does not yet exist in the CollectorRegistry. Unfortunately Prometheus only allows certain characters to be used for metric names, sanitizeName takes care of converting the Actuator metric name into a format Prometheus will accept. Consider your metric naming convention when planning to monitor a large number of metrics.
class PrometheusMetricWriter implements MetricWriter {

    CollectorRegistry registry
    private final ConcurrentMap<String, Gauge> counters = new ConcurrentHashMap<>()
    private final ConcurrentHashMap<String, Gauge> gauges = new ConcurrentHashMap<>()

    @Autowired
    public PrometheusMetricWriter(CollectorRegistry registry) {
        this.registry = registry
    }

    @Override
    void increment(Delta<?> delta) {
        counter(delta.name).inc(delta.value.doubleValue())
    }

    @Override
    void reset(String metricName) {
        counter(metricName).clear()
    }

    @Override
    void set(Metric<?> value) {
        gauge(value.name).set(value.value.doubleValue())
    }

    private Counter counter(name) {
        def key = sanitizeName(name)
        counters.computeIfAbsent key, { k ->
            Counter.build().name(k).help(k).register(registry)
        }
    }

    private Gauge gauge(name) {
        def key = sanitizeName(name)
        gauges.computeIfAbsent key, { k ->
            Gauge.build().name(k).help(k).register(registry)
        }
    }

    private String sanitizeName(String name) {
        return name.replaceAll("[^a-zA-Z0-9_]", "_")
    }

}
PrometheusEndpoint
The PrometheusEndpoint simply converts the current state of the CollectorRegistry into the Prometheus TextFormat provided by the client API.
class PrometheusEndpoint extends AbstractEndpoint<String> {

    CollectorRegistry registry

    PrometheusEndpoint(CollectorRegistry registry) {
        super('prometheus',false, true)
        this.registry = registry
    }

    @Override
    String invoke() {
        Writer writer = new StringWriter()
        TextFormat.write004(writer, registry.metricFamilySamples());
        writer.toString()
    }
}
PrometheusMvcEndpoint
The PrometheusMvcEndpoint exposes the string provided by the PrometheusEndpoint over HTTP and marks the content type on the request to be of type CONTENT_TYPE_004 which is a simple text format.
class PrometheusMvcEndpoint extends AbstractEndpointMvcAdapter<PrometheusEndpoint>{

    PrometheusMvcEndpoint(PrometheusEndpoint delegate) {
        super(delegate)
    }

    @RequestMapping(method = RequestMethod.GET, produces = TextFormat.CONTENT_TYPE_004)
    @ResponseBody
    @HypermediaDisabled
    protected Object invoke() {
        if (!getDelegate().isEnabled()) {
            return new ResponseEntity<Map<String, String>>(
                    Collections.singletonMap("message", "This endpoint is disabled"),
                    HttpStatus.NOT_FOUND)
        }
        super.invoke()
    }
}
Hooking up the Prometheus Endpoint
The cleanest way to add the new endpoint to the Spring Boot Application is to configure it through a property in src/main/resources/META-INF/spring.factories
org.springframework.boot.actuate.autoconfigure.ManagementContextConfiguration=\
codes.monkey.prometheus.PrometheusEndpointContextConfiguration
@ManagementContextConfiguration
class PrometheusEndpointContextConfiguration {

    @Bean
    PrometheusEndpoint prometheusEndpoint(CollectorRegistry registry) {
        new PrometheusEndpoint(registry)
    }

    @Bean
    @ConditionalOnBean(PrometheusEndpoint.class)
    @ConditionalOnEnabledEndpoint("prometheus")
    PrometheusMvcEndpoint prometheusMvcEndpoint(PrometheusEndpoint prometheusEndpoint) {
        new PrometheusMvcEndpoint(prometheusEndpoint)
    }

    @Bean
    CollectorRegistry collectorRegistry() {
        new CollectorRegistry()
    }

    @Bean
    @ExportMetricWriter
    MetricWriter prometheusMetricWriter(CollectorRegistry registry) {
        new PrometheusMetricWriter(registry)
    }

}
With all the parts of the new Endpoint in place, it shoud be available under http://localhost:8080/prometheus. Next step is to setup the Prometheus server and configure it to poll this new Endpoint.
Prometheus Installation & Configuration
mkdir /opt/prometheus && cd /opt/prometheus
wget https://github.com/prometheus/prometheus/releases/download/0.16.2/prometheus-0.16.2.linux-amd64.tar.gz
tar -xvf prometheus-0.16.2.linux-amd64.tar.gz
ln -sf /opt/prometheus/current /opt/prometheus/prometheus-0.16.2.linux-amd64
A basic configuration file that polls the new Endpoint would look something like this:
global:
  scrape_interval:     15s
  evaluation_interval: 30s

scrape_configs:

  - job_name: 'spring-boot-restful'

    scrape_interval: 5s
    scrape_timeout: 10s
    metrics_path: '/prometheus'

    target_groups:
     - targets: ['localhost:8080']
Running prometheus:
./prometheus -config.file=prometheus.yml
What's the point without a pretty dashboard?
Grafana provides a professional looking configurable dashboard to front the metric data captured by Prometheus.
mkdir /opt/grafana && cd /opt/grafana
wget wget https://grafanarel.s3.amazonaws.com/builds/grafana-2.6.0.linux-x64.tar.gz
tar -xvf grafana-2.6.0.linux-x64.tar.gz
cd grafana-2.6.0
./bin/grafana-server web
Then configure Grafana to use Prometheus.
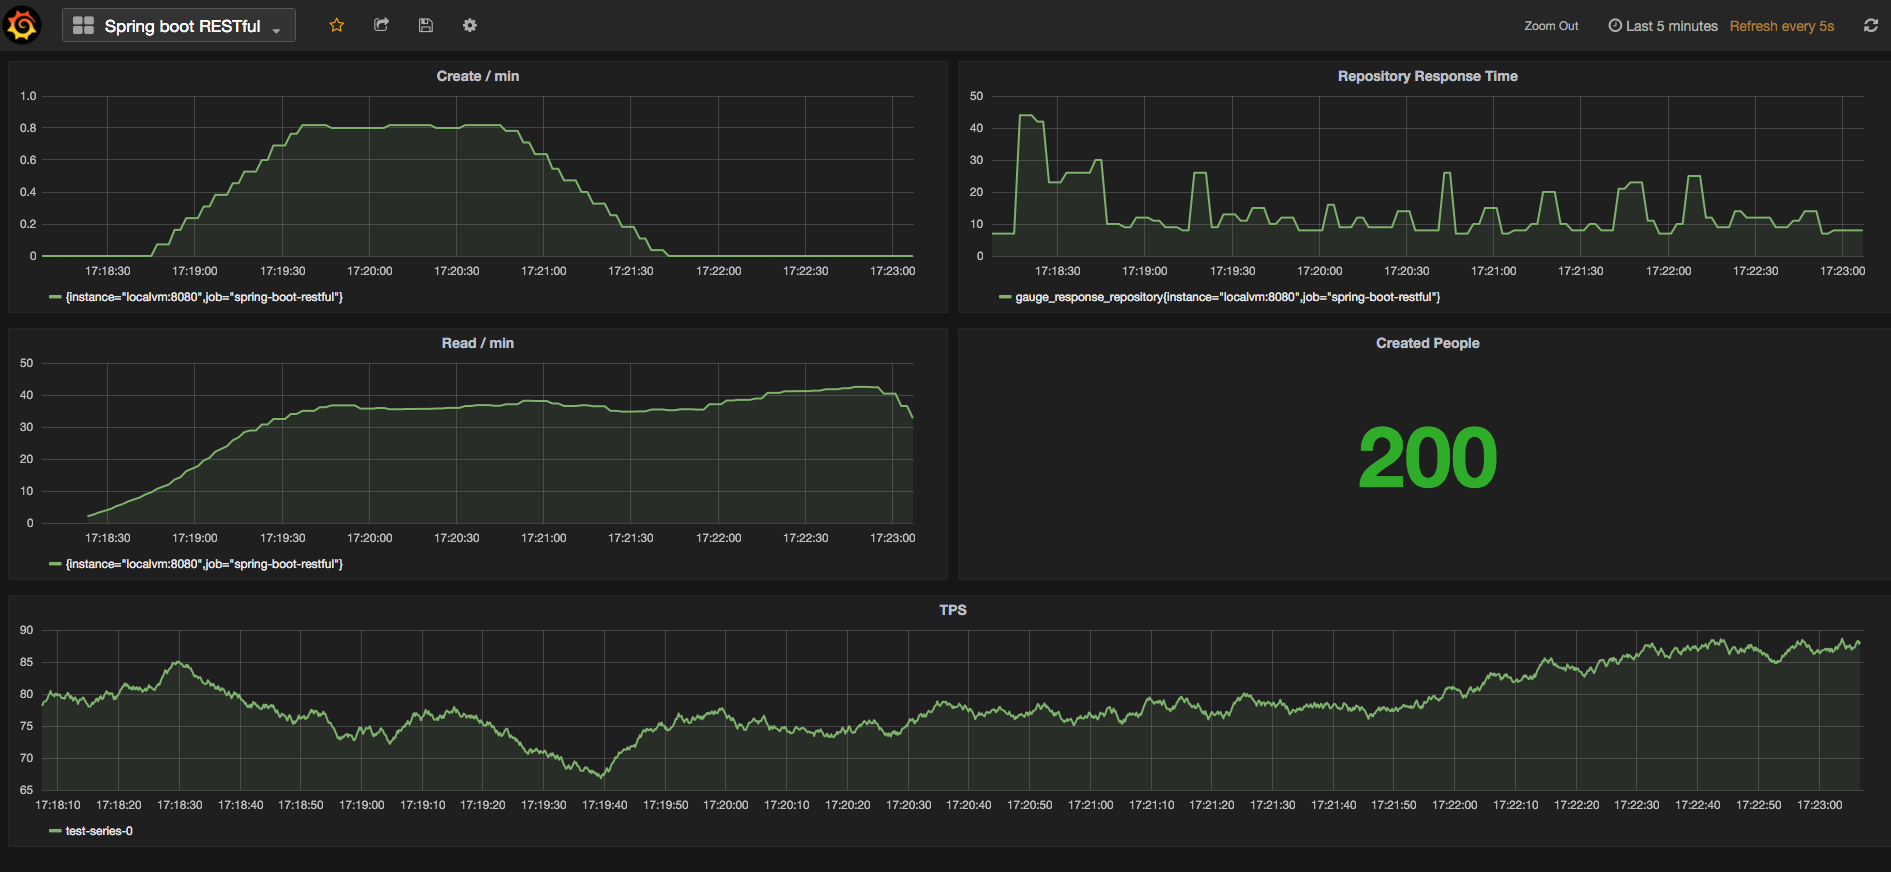
Here is the JSON export for this dashboard in grafana.
Limitations
At the time of writing, I found that there is no obvious way to get Actuator to report distinct metrics for every HTTP method supported by @RepositoryRestResource. It only captures the gauge.response.repository metric, which is a mixture of GET, POST, PUT and DELETE response times even though these HTTP methods will likely have different performance characteristics.
The code described in this post is available at github.