
This post will look at 2 ways to extract performance metrics out of a Spring Batch Job using Dropwizard Metrics. The solution discussed here will produce Reader, Processor and Writer throughput and mean times in addition to counters for skipped items by logging the metrics in a pre-configured interval to a log file. Armed with this information you will be able to answer questions like: Is the job running?, How long will it take?, Which part is taking up the most time? and many more without having to wait until the job completes.
Two approaches to the problem
The solution relies on Dropwizard Metrics to perform the measurements and periodically report the metrics. The code samples are concerned with how to configure Dropwizard to collect metrics.
The simplest approach is applying the Decorator Pattern to every Reader, Processor and Writer in the job by wrapping each of the components with Classes that configure the Dropwizard timers. The second approach combines Spring Batch life cycle event listeners and a State Pattern to produce the desired metrics.
In both cases the metrics will be logged every 30s via the Slf4jReporter provided by Dropwizard to the codes.monkey.batchstats.eventdriven.StatsListener logger.
Decorator Driven Approach
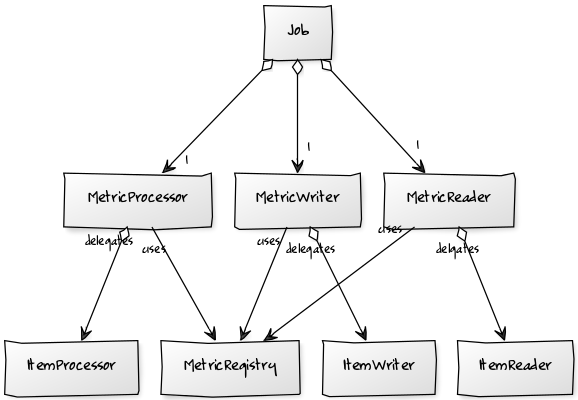
The straight forward approach is to wrap the existing Reader, Processor and Writer with their corresponding decorators MetricReader, MetricProcessor and MetricWriter implementations. A DecoratorFactory simplifies the configuration.
All metrics are namespaced based on the job and step it belongs to, for example, given sampleJob with a sampleStep, will produces log entries similar to:
The sample implementations of the MetricReader, MetricProcessor and MetricWriter are not suitable for a multi threaded batch job, however moving the StatsNamespace field in each of them to a ThreadLocal variable should be enough to get it working in a multi threaded job. (This has not been tested!)
Event Driven Approach
The event driven approach relies on the life cycle events built into Spring Batch. Typically timers will start when the metric listener receives a before* event, like beforeRead, and stop on afterRead. Unfortunately these events are not always balanced. One example of this is during the last read Spring Batch will dispatch a beforeRead followed by the Reader producing a null value. The next event produced by the framework is a beforeProcess, leaving the initial beforeRead without the opposite afterRead to signal the read timer to stop. Applying the State Pattern solves the problem to a large degree with a few caveats:
- Jobs must have a ItemProcessor, the state machine relies on some of the processor events to produce synthetic events that in turn provides a more balanced interface to the timers. A PassThroughItemProcessor can be used in situations where the job does not need to do any processing.
- Once a process or write error happens in a chunk, the subsequent re-processing of the chunk will not emit processing or write events. The main reasons for this are:
- Emitting processing events in this state may yield process counts higher than the number of read items because if a chunk contains more than 1 process error the same item may be processed several times while the framework whittles down the chunk to only the items that pass processing.
- Emitting write events will also skew the numbers, since write events in this case will happen on smaller chunks. The ItemWriter will be called with a chunk of 1 to figure out where in the original chunk the write error occurred.
State diagram describing spring batch job state transitions:

Parallel Processing
With a few caveats, collecting stats in a multi threaded step is possible but does add considerable complexity. The first obvious limitation, imposed by the framework itself, is that the Reader, Processor and Writer all need to be thread-safe. Parallel processing is implemented by running each Chunk in a separate thread, this means that a copy of the state machine described above is required for each thread. Failing to do this will cause the single state machine to receive events from different threads in a nonsensical order.
The ParallelProcessingStatsListener solves the problem by storing an instance of the state machine in a ThreadLocal variable every time a beforeChunk event is received. One of the reasons the event driven approach is limited in what events can be produced during chunk reprocessing is that the reprocessing does not necessarily happen in the same thread as what the original chunk processing failed in.
Reporting
Ideally the log file produced by the above configuration can be scooped up by some log aggregation infrastructure like ELK and reports can be pulled from there. In cases where that is not an option you can use the HtmlReportJobExecutionListener which will produce a self contained HTML report once the job has completed.

Conclusion
Using the decorator driven approach is arguably the simplest way to get the majority of important metrics out of your batch job. I would only consider the event driven approach if there is a requirement to monitor chunk processing times or count errors/skipped items. Maybe a combination of the two approaches, using decorators for read, processing and write metrics combined with events for counting skips and errors or capturing step/job metrics will yield a lot of detail without all of the complexity.
Sample Code Setup
Sample code can be found on GitHub. The gradle build will expect node 8.9.1 and yarn to be installed on the system.
$ git clone https://github.com/monkey-codes/spring-batch-metrics.git
$ cd spring-batch-metrics
# if you are using nvm
$ nvm use 8.9.1
$ ./gradlew clean build
$ ./gradlew bootRun -Dspring.batch.job.names=single.thread.decorator.driven.job -Dcodes.monkey.metric.output.dir=$(pwd)/build
# to view the html report generated in the tmp folder
$ open ./build/report.html